September 23, 2009
Ten sigma: numerics and finance
 I was recently asked "What is the likelihood of a ten sigma event?"
For those of you who don't speak statistical jargon, this is a random event drawn from the Gaussian distribution that happens to be more than ten standard deviations ("sigmas") away. 68% of events go outside one sigma, just 5% beyond 2 and a mere 0.3% reach beyond 3. Ten sigma is very, very unlikely - but how unlikely?
Numerics
There are plenty of calculators online that allows you to calculate this, but most turn out to be useless since they don't give you enough decimals: the answer becomes zero. Similarly there are tables in most statistical handbooks, but they usually reach at most to 6 sigma.
OK, but how do you calculate the probability of n sigma events? The answer is deceptively simple: the probability is 1-erf(n/sqrt(2)). Erf is the error function,
![]()
It is one of those functions that can only be written in terms of integrals and tend to be called "special" or "non-elementary". Erf is a pretty common special function.
I of course opened my trusty Matlab and became annoyed. Because it only reached to 8 sigma. Beyond this point the difference between 1 and erf(x) became so small that the program treated it as zero. This is called cancellation, and is a standard problem in numerical analysis.
OK, I needed to either improve Matlab precision (doable using some add-on libraries, but annoying) or to calculate 1-erf(x) in a better way. Looking at the Wikipedia page I saw a juicy Taylor series that I stole:

Unfortunately this requires a lot of terms before it converges. For x=10, the terms become hideously large (the hundredth term is 10^40) before declining *very* slowly. Worse, Matlab cannot handle factorials beyond 170!, so the calculation breaks down after the first 170 terms without converging.
The next formula I tried was an asymptotic formula for erfc(x), the complementary error function which happens to be 1-erf(x) (given how important Gaussian distributions are, it is not that unexpected that this useful sibling of erf got its own name despite being just a flipped version).

I don't like asymptotic series. For any given x, if you add enough terms you will get a great approximation... but beyond that, if you add more terms the series diverge. I have never really gotten my head around them, but they can be useful. Except in this case I got a suspicion that the answer (7.62*10^-24) was wrong - but how could I check it?
At this point I remembered to turn to The Good Book. The Big Blue Book to be exact, Abramowitz and Stegun's Handbook of Mathematical Functions. As a kid I was addicted to cool formulas, and when I found a copy of this volume in the cellar of Rönnells used book store in Stockholm I used most of my savings to buy it. Yes, most was completely useless tables of Bessel functions or even random numbers, but it also contained pages filled with the strangest, most marvellous analytical expressions you could imagine!
In any case, looking on page 298 I spotted something promising. Equation 7.1.13 shows that erfc lies between two pretty modest-looking functions:
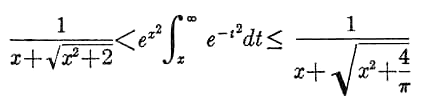
If this worked, it be possible to calculate bounds on 1-erf(10/sqrt(2)). But would it work without cancellation or other nasty numerics? I plotted the three functions side by side... and the curves nearly coincided perfectly! The formula is a very decent approximation when x is above 3.
Finally I could calculate my 10 sigma probability. As the table shows the Matlab implementation of the erf function starts misbehaving even at n=8, when it crosses the lower bound.
| n | Lower bound | 1-erf(n/sqrt(2)) | Upper bound |
| 1 | 2.990923*10^-1 | 3.173105*10^-1 | 3.356963*10^-1 |
| 2 | 4.472758*10^-2 | 4.550026*10^-2 | 4.737495*10^-2 |
| 3 | 2.683711*10^-3 | 2.699796*10^-3 | 2.770766*10^-3 |
| 4 | 6.318606*10^-5 | 6.334248*10^-5 | 6.444554*10^-5 |
| 5 | 5.726320*10^-7 | 5.733031*10^-7 | 5.802696*10^-7 |
| 6 | 1.971960*10^-9 | 1.973175*10^-9 | 1.990693*10^-9 |
| 7 | 2.558726*10^-12 | 2.559619*10^-12 | 2.576865*10^-12 |
| 8 | 1.243926*10^-15 | 1.221245*10^-15 | 1.250748*10^-15 |
| 9 | 2.256867*10^-19 | 2.266717*10^-19 | |
| 10 | 1.523831*10^-23 | 1.529245*10^-23 |
So there we are: ten sigmas occur with probability 1.5265*10^-23 (plus or minus 2.7*10^-26). My asymptotic calculation was 50% off! Of course, if I really needed to trust the result I would have done some extra checking to see that there were no extra numerical errors (dividing by the functions above produces 1, so here doesn't seem to be any cancellation going on).
It should be noted that the above table is the probability of an outcome being more than 10 sigmas above or below the mean. If you are interested in just outcomes going 10 sigma high, then it is half of these numbers.
Finance
Here at FHI we actually care about ten sigma events. Or rather, what apparent ten sigma events can tell us about the correctness of models people make. Consider this quote:
According to their models, the maximum that they were likely to lose on any single trading day was $45 millioncertainly tolerable for a firm with a hundred times as much in capital. According to these same models, the odds against the firm's suffering a sustained run of bad lucksay, losing 40 percent of its capital in a single monthwere unthinkably high. (So far, in their worst month, they had lost a mere 2.9 percent.) Indeed, the figures implied that it would take a so-called ten-sigma eventthat is, a statistical freak occuring one in every ten to the twenty-fourth power timesfor the firm to lose all of its capital within one year.R. Lowenstein, "When Genius Failed: The Rise and Fall of Long-Term Capital Management," Random House, 2001, pp. 126127.
(I lifted the quote from The Epicurean Dealmaker, who quite rightly back in 2007 pointed out that people had not learned this lesson. there is also this alleged 23-sigma event - the probability for that in a Gaussian distribution is 4.66*10^-177.)
Whenever a model predicts that something will fail with a negligible chance, the probability that the model can fail becomes important. Quite often that probability overshadows the predicted risk by many orders of magnitude. Making models robust is much more important than most people expect. (this was the point of our LHC paper) In the case of finance, it is pretty well understood (intellectually if not in practice) that the heavy tails produce much more big events than the Gaussian model predicts. When we see a 10-sigma it is a sign that our models are wrong, not that we have been exceedingly unlucky.
This is true for mathematics too. While math is consistent and "perfect" (modulo Gödel), our implementations of it - in brains or software - are essentially models too. The chance that any math function is badly implemented, wrongly implemented or has numeric limitations is pretty high. One should always check correctness to the extent the cost of error times its likelihood suggests. A bit of cancellation might not matter in the computer game, but it does matter a lot when launching a space probe.
23 Sept 2009 Update: Toby Ord kindly pointed out a miscalculation of the error of the asymptotic series. One should never math blog after midnight. The real error is also very close to 50%, so is likely that it was due to a missed factor of 2 somewhere. See what I mean about the likelihood of errors in human math implementations?
24 Sept 2009 Update: Checking the result in Mathematica with a high precision setting, I get the ten sigma probability to be 1.523970*10^-23, which is inside the confidence interval.
Posted by Anders3 at September 23, 2009 12:50 AM