September 21, 2009
Life extension model
Dirk Bruere on the Extrobritannia mailing list asked a provocative question:
Any serious H+ predictions of longevity trends between now and (say) 2050 for various age groups? I would expect our predictions to start to deviate from the "official" ones at some point soon.
This led me to develop a simple model of life extension demographics. I'm not a professional demographer and it depends on various assumptions, so take this with a suitable amount of salt.
Summary of my results: I do not see any unexpected demographic changes before life extension breakthroughs, and age at death will not rise until a while after - despite potentially extreme rises of cohort life expectancy. (Flickr photostream) I also think we 30+ transhumanists should be seriously concerned about speeding basic and transitional research, and look at alternative possibilities (cryonics, possibly WBE).
Model
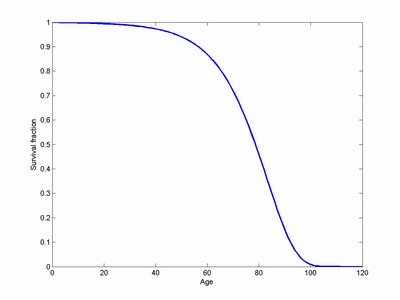
The death rate is equal to min(1, 1/10000 + 10.^(agedam*3/80-4.2)) This is a Gompertz-Makeham law with a low age-independent component and an exponential component that is driven by ageing damage (agedam). Ageing damage is initially increasing at a rate of 1 per year. This model produces a passable survival curve with a life expectancy of 78.6 years.
Life extension takes the form of a reduction in the rate of age damage per year. This stretches the mortality curve. I assume that due to technology development it has a sigmoid form:
deltadamage = (1-.5*fixable)-fixable*.5*tanh((year-midyear -(1-wealth)*wealtheffect)/g)
where fixable is the fraction of age damage that can be fixed in the long run, midyear is the inflexion point of the sigmoid (50% of the possible reduction in age damage has been achieved) and g is a factor determining how rapidly the transition is from one unit of damage per year to 1-fixable units per year occur. For large g this is a slow transition, for small g this occurs quickly (as a rule of thumb, the "width" of the transition is 4g years).
To model technology diffusion and cost effects each individual has a wealth statistic uniformly distributed between 0 and 1, which determines (together with the parameter wealtheffect) how many years "behind" the individual is. A person with zero wealth will be wealtheffect years behind the technology curve.
Deaths are exactly balanced by an equal number of births. This corresponds to the assumption of a stable population. This is of course questionable, and I also get some problems when bumps of the population dies at about the same time.
100,000 individuals were simulated over 1000 years, with the midyear set to year 150. Data was collected on when individuals died enabling calculating the cohort life expectancy of their years of birth, as well as the average age at death in different years.
Scenario parameters
What are plausible values for fixable, g and wealtheffect?
In the case of fixable, this could range from 0 (no life extension is possible) to more than 1 (age reversal is possible). An optimistic scenario (radical life extension) assumes fixable is 1, a more sceptical scenario (moderate life extension) assumes it is 0.5.
g is even trickier to estimate, since it is a combination of scientific/medical progress and technology diffusion. It will depend on whether the treatment is simple like a vaccine (rapid diffusion) or requires extensive equipment and expertise like MRI (slow diffusion). Similarly, for ageing we have reason to believe that testing will be slow (biomarkers will only get us part of the way). If something like SENS is used the development might actually be something like the sum of 7 separate sigmoids, each fixing part of the problem, again broadening the curve. My optimistic scenario is that the transition takes ~15 years (g=4), comparable to the spread of ultrasound, CT scanners and hybrid seedcorn. A pessimistic scenario is more like the introduction of the car or flu vaccine, producing a ~50 year transition (g=12.5).
The effect of wealth is hard to model properly, especially since this will be strongly affected by societal choices. The optimistic model is that the difference between top and bottom will be on the order of 15 years (diffusion of modern gadgets; likely most plausible for simple intervention or with strong subsidies), the pessimistic model a 50 years interval. There is plenty of room here for further experiments, such as assuming that a certain fraction never adopts it (for wealth or ideological reasons), skew income distributions etc.
These assumptions provide us with 8 possible models, spanning the assumptions.
To apply the model on the real world, we should also take into account when the technology is "discovered". As a very rough estimate, it takes at least 10 years in the lab to produce something ready for clinical trials, which take 10 more years. So we should cautiously estimate that midyear occurs 25+2g years after the discovery. That is, 32.5 years for the optimistic scenario, and 50 years for the pessimistic one. This is used to set year 0 to the "discovery", allowing us to compare how quickly things change after it.
Simulation results
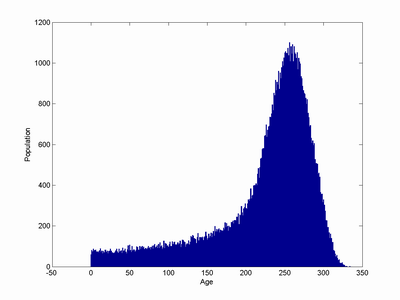
The overall behaviour of the model is simple: initially there is a steady state distribution corresponding to the pre-life extension status quo. As life extension arrives it begins to move right. The lower mortality produces lower birth rates, the population is dominated by a lump of older people who were lucky enough to get treatment in time. As the peak of "first immortals" marches onwards it gradually declines due to the constant mortality rate, but it remains significant for a very long time. Eventually the model converges to a very elongated exponential distribution entirely due to the constant mortality.
Calculating mean age at death in the model is simple, while cohort life expectancy only works up to the point where there are survivors at the end of the simulation. Hence for some of the simulations the life expectancy is only plotted up to the birth year of the first survivor. There is some oscillations in average age at death due to synchronized fluctuations of the population; these are artefacts due to the simplistic birth model (however, in a real demographic model they could also occur due to the simultaneous passage of large cohorts through the fertile age range).
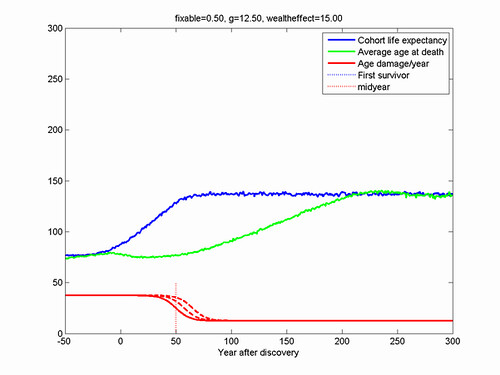
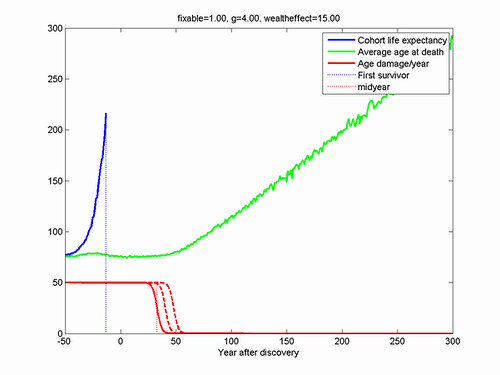
Assuming fixable=0.5 produces a lifespan of ~140 years, while for fixable=1 it is 2000+ (my constant mortality rate should likely be higher to be plausible).
Flickr photostream of the scenarios.
The effect on real life expectancy (rather than estimated life expectancy) starts around a *lifetime* earlier than the midyear of the technology - it gives enough help to the already old when it arrives that they will survive further. More radical life extension has a quicker take-off. Note that this take-off occurs long before there is any noticeable effect on the average age at death: that only occurs after the technology has both matured and become widespread. This is
because the deaths during this intermediate period are largely due to people who never got life extension, while deaths after the technology is widespread have been influenced by its effects.
This implies that the discrepancy between current forecasts and reality may be far bigger than most people think, if we are right about the feasibility of radical life extension this century. It also shows that even if effective life extension is spreading in a society the demographic indicators will not react quickly to it.
In terms of prediction, this model suggests that we will not see any demographic changes before the breakthroughs, and age at death will not rise until long while after (roughly wealtheffect + 4g years). The true observables that predict a breakthrough will likely be in the form of labwork and clinical trials, not any demographics.
Guesses
What about our chances? It all depends on when we think the basic solutions are going to be discovered. In the earliest scenario (radical life extension, rapid tech improvement, little wealth effect) cohort life expectancy starts to increase 25 years *before* the discovery. In fact, at the time of discovery most people under 30 will be around for indefinite life extension. If the technology development is slower, then the cohort born at the same time as the discovery will "just" have about 150-230 years of life expectancy, depending on how fast it spreads in society.
If only mild life extension is possible people born at the discovery time still have more life expectancy than expected, although not as much as future generations will have. People under 50 will get some life extension if societal spread is fast, and the under 30s if it is slow.
My personal intuition is that we are not far from early research breakthroughs (they might have occurred already), so we might be somewhere around year -10 to 0. I end up with the general life extension social breakthrough somewhere 2040-2060. Great news for current kids, a bit more worrying for us at 30+.
An interesting implication is that pension funds and similar long term investments might be very relevant for us 30+ transhumanists - they might be what matters if we are to self-fund life extension in the early expensive days in order to squeeze past the bottleneck. Of course, there are other potentially powerful technologies that could arrive before or during this period (I would expect human whole brain emulation somewhere in the middle of it), but the prudent thing is to save up.
My model seems to be rather sensitive to transitional research speed - if we can speed that up, then we might gain more than just life extension, such as better medicine in general. Similarly, it might be rational from a kind of Rawlsian perspective to aim for rapid spread across society - most of us do not know how wealthy we will be in 50+ years (not to mention that we might actually care about other people... imagine that!)
Appendix: Matlab/Octave code
% Simple life extension model
N=100000; % population
maxyear=2000; % 2000 years of simulation
midyear=150; % When technology is at 50 percent
for fixable=0.5:0.5:1;
% how much age damage can be fixed
for g=4:8.5:12.5;
% how quickly transition pre and post
for wealtheffect = 15:35:50; % how many years after is low-wealth people?
clf
% Generate initial age distrivution
age=zeros(N,1);
for i=1:N
age(i)=ceil(rand*100);
while (rand>prod(1-mortality(1:age(i))))
age(i)=ceil(rand*100);
end
end
hist(age);
born=-age;
agedam=age;
wealth=rand(N,1);
meanagedeath=zeros(maxyear,1);
lifetable=[];
for year=1:maxyear
age=age+1;
agedam=agedam + ((1-.5*fixable)-fixable*.5*tanh((year-midyear - (1-wealth)*wealtheffect)/g));
% age damage initiall incs as 1 per year, then sigmoid decline
% tech used based on wealth
mortality = 1/10000 + 10.^(agedam*3/80-4.2);
mortality=(mortality<1).*mortality+(mortality>=1);
dies = rand(N,1)
lifetable=[lifetable; year*ones(length(find(dies)),1) born(dies)];
% Births
% Assumes replacement births keeping population constant
age(dies)=0;
agedam(dies)=0;
wealth(dies)=rand(length(find(dies)),1);
born(dies)=year;
% Plot population every century
if (rem(year,100)==0)
hist(age,0:maxyear)
drawnow
end
end
% Calc cohort life expectancy
lifexpect=zeros(maxyear,1);
for year=1:maxyear
X=find(lifetable(:,2)==year);
lifexpect(year)=mean(lifetable(X,1)-lifetable(X,2));
end
% Plot everything
% everything scaled so that year 0 is "discovery"
xtrans = 150-(25+2*g);
clf
year=1:maxyear;
lim=maxyear-max(age);
plot(year(1:lim)-xtrans, lifexpect(1:lim),'LineWidth',2)
hold on
plot(year-xtrans, meanagedeath,'g','LineWidth',2)
plot(year-xtrans,50*(.5-fixable*.5*tanh((year-midyear - (1-1)*wealtheffect)/g)),'r','LineWidth',2)
plot(maxyear-max(age)*[1 1]-xtrans,[0 max(lifexpect(1:lim))],'b:','LineWidth',2)
plot(midyear*[1 1]-xtrans,[0 50],'r:','LineWidth',2)
axis([-50 300 0 300])
xlabel('Year after discovery')
ylabel('')
legend('Cohort life expectancy','Average age at death','Age damage/year','First survivor','midyear')
title(sprintf('fixable=%2.2f, g=%2.2f, wealtheffect=%2.2f',fixable,g,wealtheffect))
plot(year-xtrans,50*(.5-fixable*.5*tanh((year-midyear - (1-0.5)*wealtheffect)/g)),'r--','LineWidth',2)
plot(year-xtrans,50*(.5-fixable*.5*tanh((year-midyear - (1-0)*wealtheffect)/g)),'r--','LineWidth',2)
% Save picture
print('-dpng',sprintf('F%2.2fG%2.2fW%2.2f.png',fixable,g,wealtheffect))
end
end
end