March 24, 2009
Mercator Mandelbrot
Thanks to an idea used by David Madore as a map for his Mandelbrot set zoom, I have been happily rendering Mercator Mandelbrot Maps during free time this weekend.
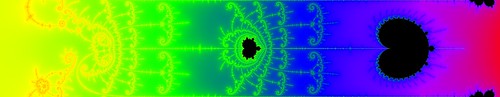
The idea is to focus on a point in or near the Mandelbrot set, and create an image where one direction is the logarithm of the distance and the other one the angle. The result is very much like the astro-ph/031571 map and theXKCD cartoon versions. This map projection is conformal, so it does not distort local angles, and objects are usually recognizable on all scales.
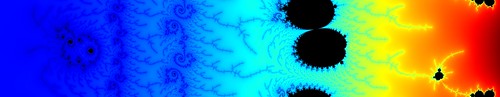
The leftmost edge corresponds to a scale of ~10-15, at which point Matlab's numeric resolution starts to become too crude to allow deeper zooms. I'm looking into using higher accuracy routines to calculate truly long maps. At the rightmost edge is the main part of the set, sometimes amusingly warped
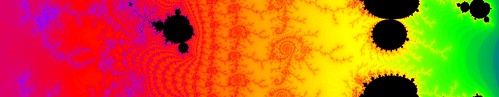
Finding a good zoom location is equivalent to finding a place on the set where there is the right amount of detail on many different scales. Tip edges like c=i and Misiurewicz points produce repeating patterns. A nice heuristic for a "baroque style" picture is to go for the mini-Mandelbrots, zoom in close to them, find another mini, zoom in there and so on. This way the sets become surrounded by embedded Julia sets, and each new mini-Mandelbrot contributes another set, adding variation to the picture.
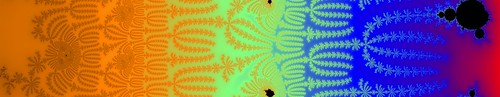
I first used the continuous potential method to color the image, but it makes filaments hard to see. I found the distance estimator method much better, since it really shows the gorgeous complexity. This way it is usually possible to trace the filament leading to the deepest part of the picture all the way out to the main set.