January 21, 2007
Competing Threads?
Recently Damien Broderick suggested that there might be an upper limit to the number of simultaneous threads on a mailing list. I got curious and tried to test this for the Omega mailing list, where I have several years of saved traffic.
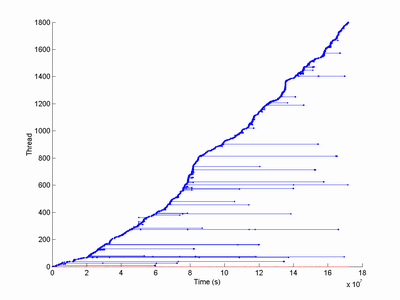
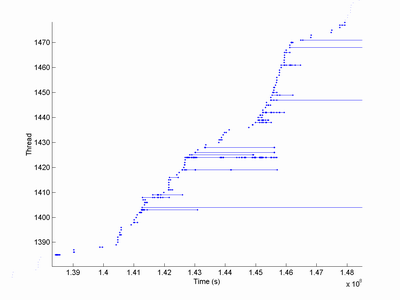
Plotting the extent of threads across time shows an overall pattern of mostly very short threads with a few much longer ones. Some of the longest are likely spurious, due to two different discussions getting the same heading. Zooming in shows a self-similar pattern of threads of widely varying length, periods of rapid posting (producing a nearly vertical ascent of the main curve) and slowdowns.
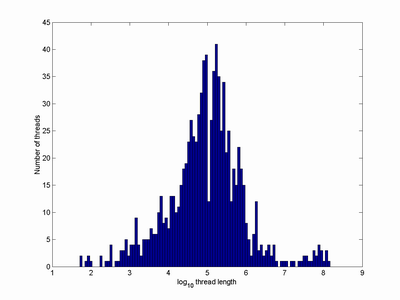
The overall length distribution of threads is lognormal, with a small cluster of extra long threads perhaps due to unfiltered spurious threads or recurring themes.
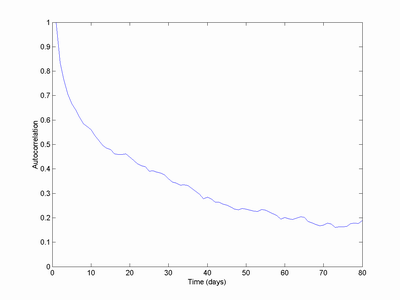
Looking at the number of different threads that are active on the same day (ignoring threads longer than one year, as these are definitely spurious) shows an irregular, bursty behavior:
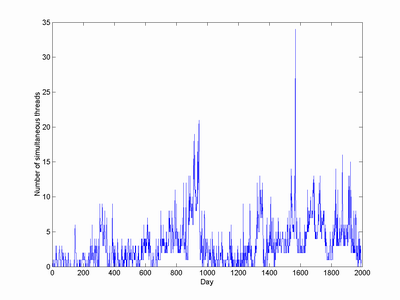
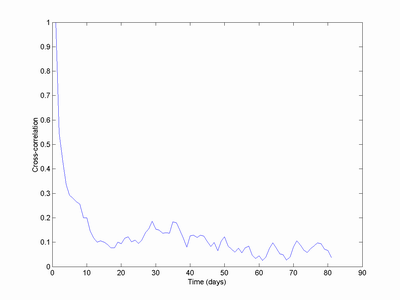
There doesn't seem to be a fixed baseline, rather periods where the baseline is zero, a small number of threads or a burst of many simultaneous threads. It almost looks like a bounded random walk plus some high frequency noise. The distribution looks like a power law for large number of threads but more like an exponential curve for lower levels of activity. The autocorrelation looks nicely exponential with a time constant of about a month, while the actual posting intensity becomes uncorrelated within a few days.
Plotting the length of threads as a function of the average number of other threads during the run produces the following pattern:
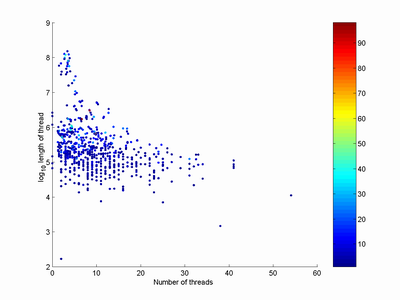
Color represents the number of postings in each thread. At first this seems to support Damien's idea: the most long-lived threads occured near the average levels of activity. Unfortunately these threads of course average over a long period of list activity, so they have to be close to average! Using the maximum number of simultaneous threads during the history of the thread produces a rising curve - the opposite of what we should expect if there is thread competition.
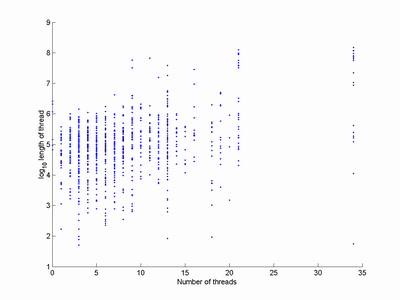
Plotting the number of threads each day versus the number of postings produces this diagram:
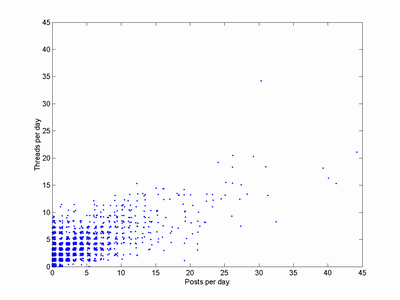
(I have jittered the positions of the points to make the density more obvious, otherwise they would just have formed a grid in the core area). It looks like a rather linear relation: more threads, more posts and roughly the same number of posts per each new thread (or vice versa). If threads competed there ought to be a curve in the point cloud, but there doesn't seem to be any. Possibly high-traffic threads produce a large number of offshoot threads that really should be regarded as part of the main thread and hide the competition effect.
So my guess is that Damien was wrong at least about the Omega list. This is a relatively low traffic list, so maybe the more high traffic Extropians list would exhibit some interactions between the number of threads. But that is a later project.
Posted by Anders3 at January 21, 2007 11:52 PM