Abalone Fractals
Anders Sandberg, 2004
This is an exploration of a family of fractals, not particularly based in theory
but done just for he enjoyment of the images and math. All pictures used are
thumbnails, clickable for a larger version.
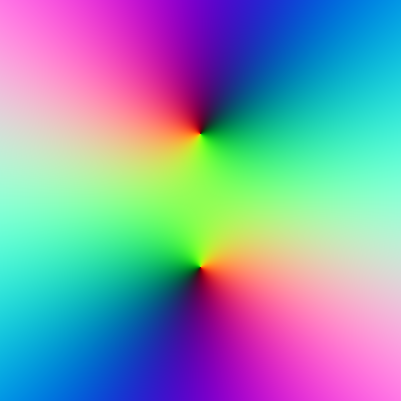
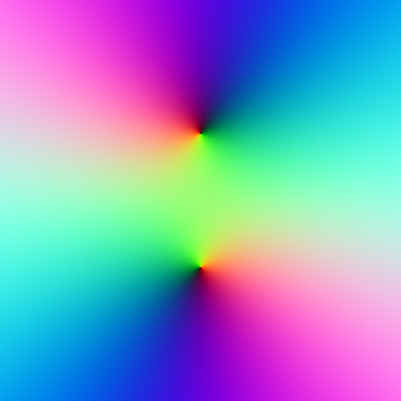
I started out with the simple rational map
zn+1=f(z)=c/(1+zn2)
where c is a complex parameter. The map has three fixed points, but the most
important points for iteration and fractals are the critical points where df/dz=0.
In this case the critical points are zero and infinity, and nicely enough f(infinity)=0,
so we only need to think about zero. The map has simple poles at +i and -i.
 The
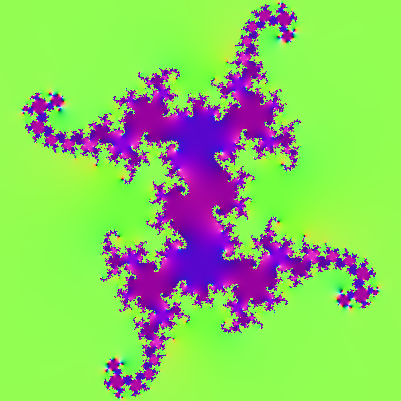
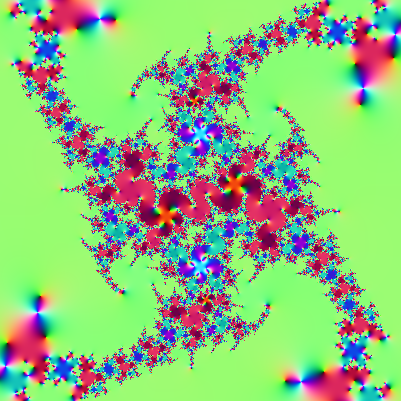
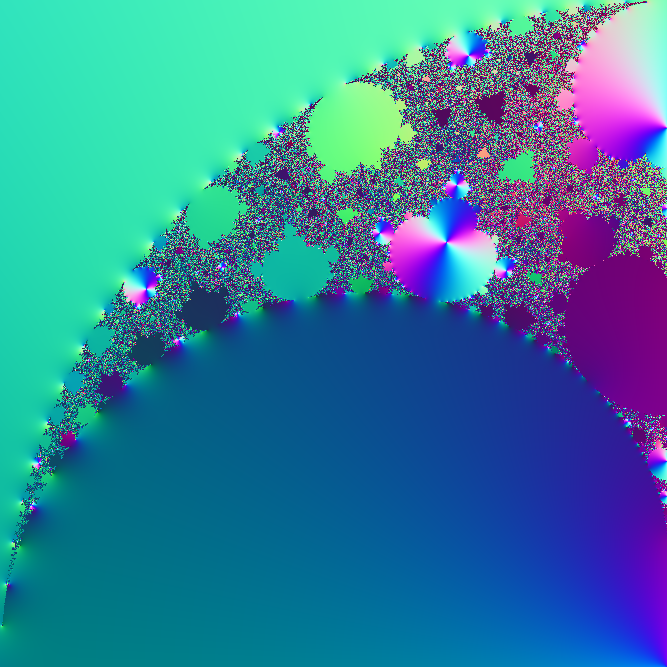
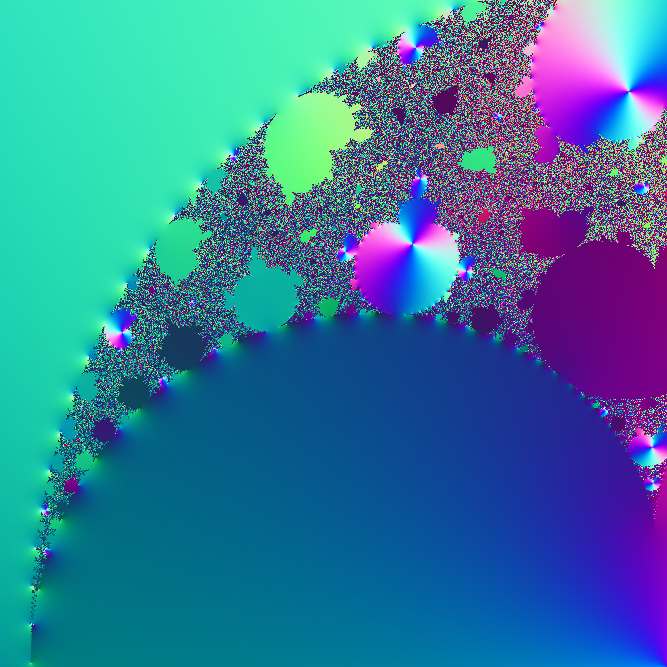
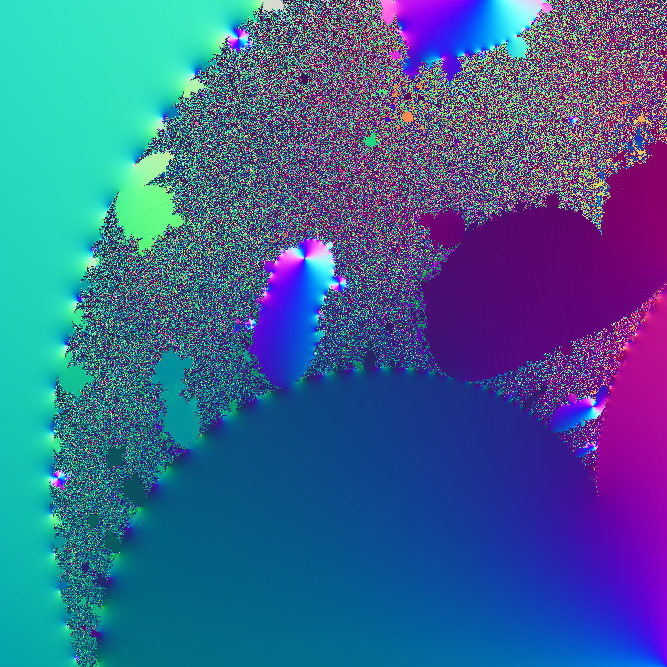
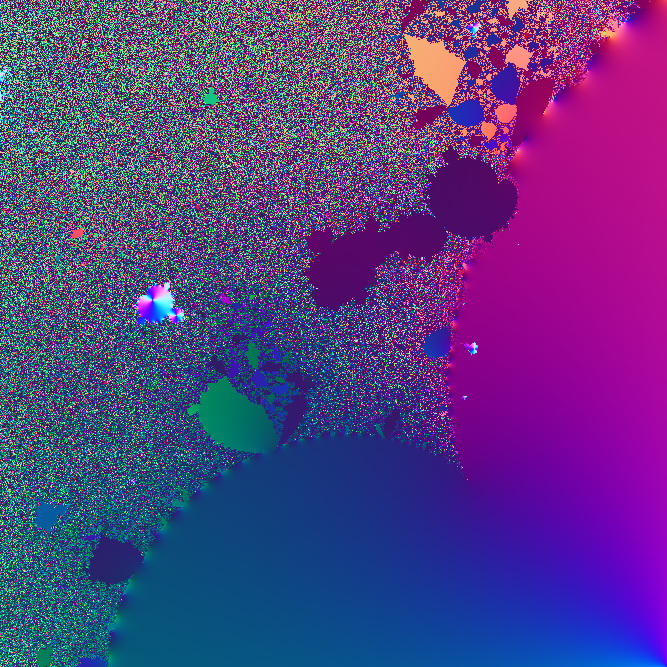
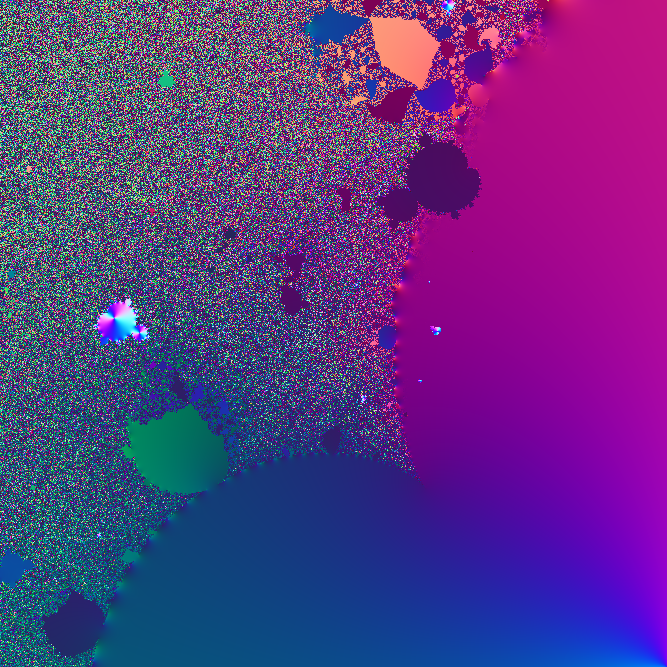
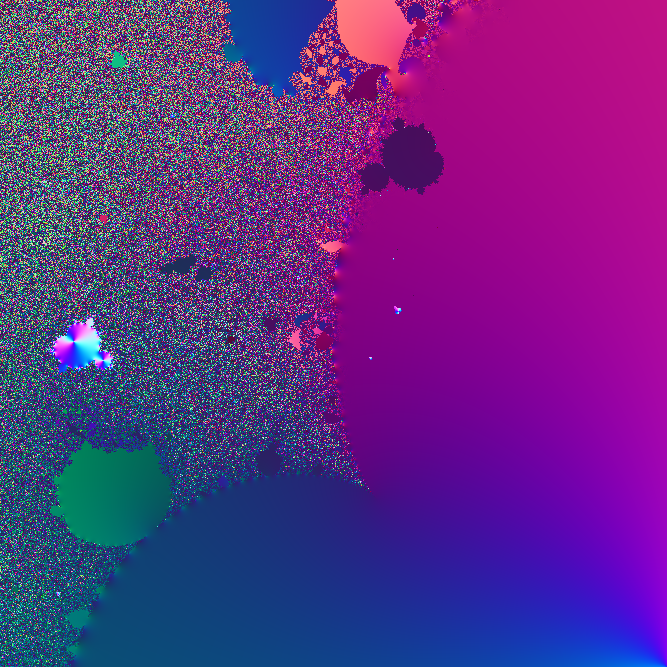
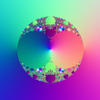
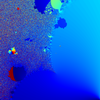
coloring used below is as follows: the red and green component are colored depending
on the sine and cosine of the argument of the point, while the blue component
is 1/(1+abs(z)). Zeros will have some white in their vicinity, poles some black.
The
coloring used below is as follows: the red and green component are colored depending
on the sine and cosine of the argument of the point, while the blue component
is 1/(1+abs(z)). Zeros will have some white in their vicinity, poles some black.
The dynamics will be going on on the Riemann sphere (the complex plane plus
the point of infinity) - in my opinion it is a far more practical place to play
with dynamics than the complex plane without the infinity point. Unlike the
ordinary Mandelbrot-Julia iteration of zn+1=zn2+c,
points do not escape permanently to infinity since they are brought back again
by the inversion part of the function.
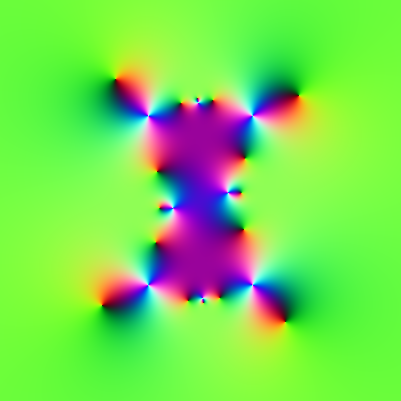
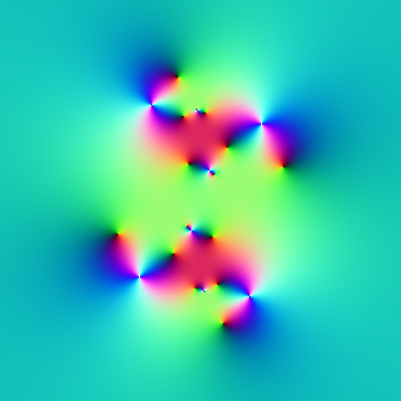
Now, since f(z) wraps the complex plane twice around itself (since it is a
second degree rational function) the pattern in the previous iteration will
be doubled. That means that near each pole there will appear two new poles in
the next iteration, producing an exponentially increasing number of poles of
fn(z0). There will also be points being mapped to the
fixed points, as well as points ending up in more complex orbits. The result
is an increasingly complex mess of poles and zeros (the zeros mark last iteration's
poles).

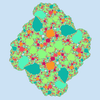
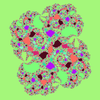
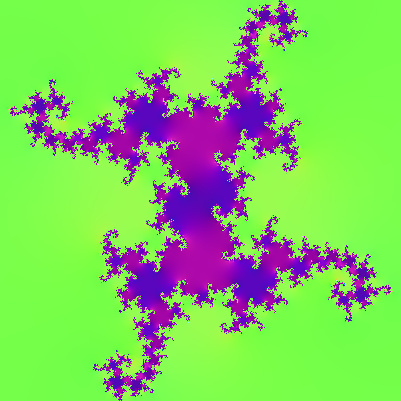
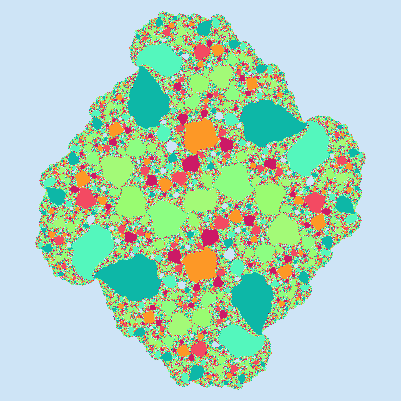
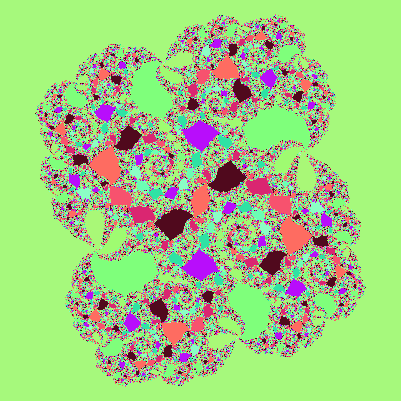
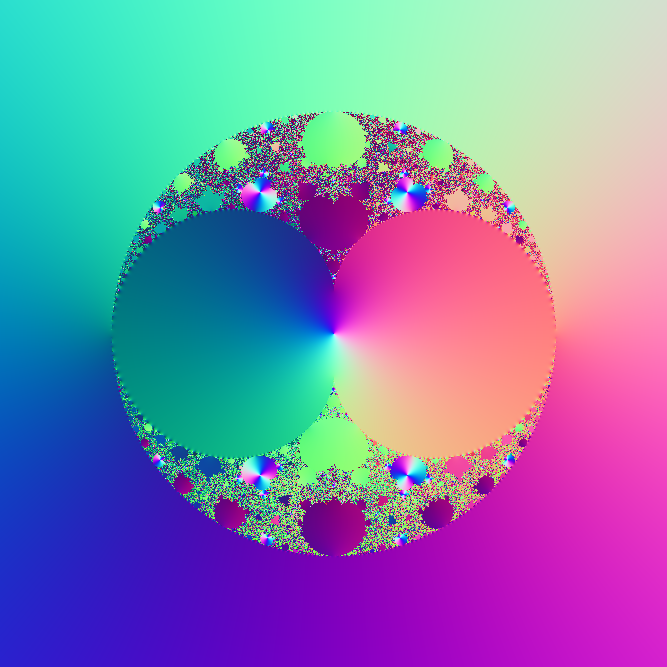
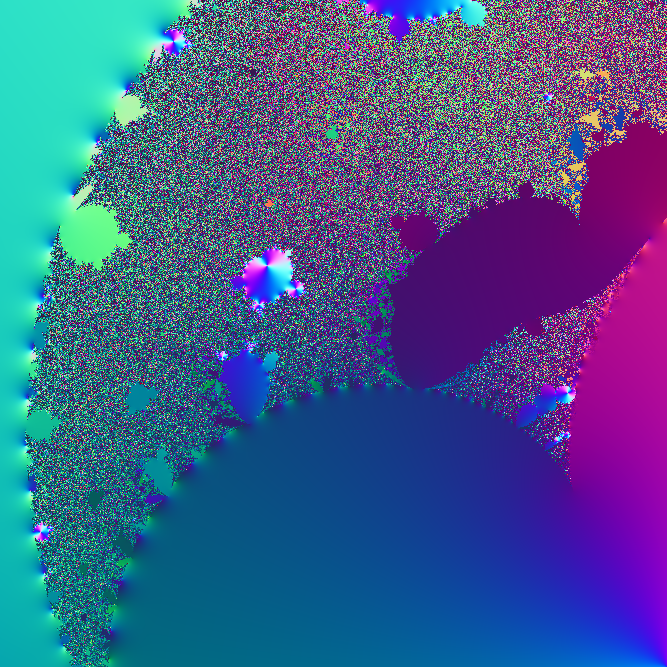
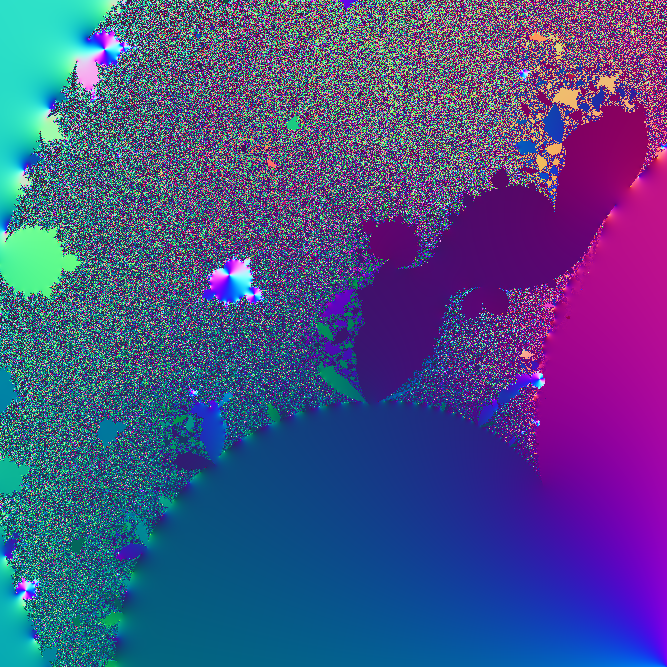
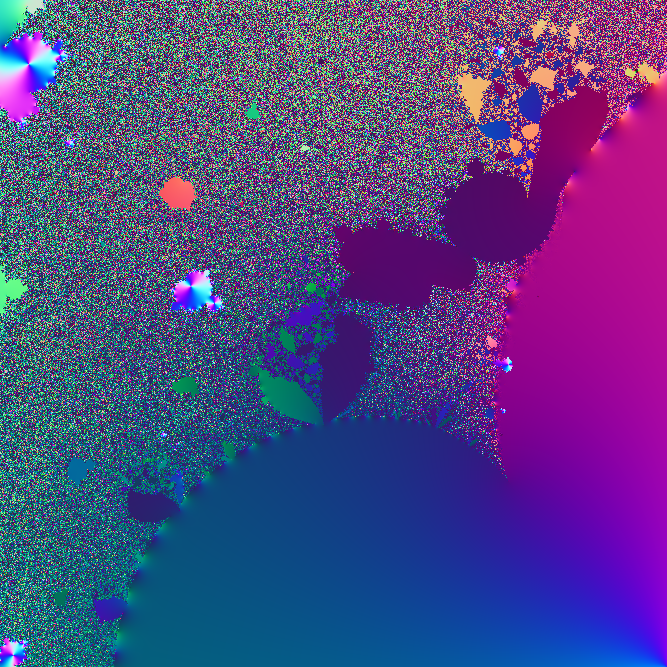
The behavior for different c's is strikingly different, as can be seen above.
For some values the limit is a number of regions where all starting values end
up in the same cycle (with different regions in different phase; the colors
cycle between them). The poles end up along the border, which is unsurprisingly
fractal. This is the Julia set of the iteration.
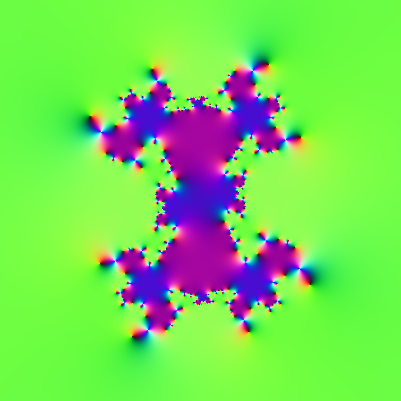
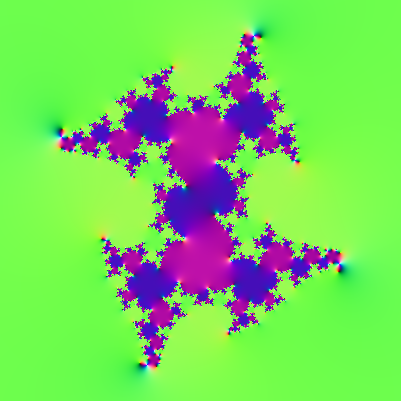
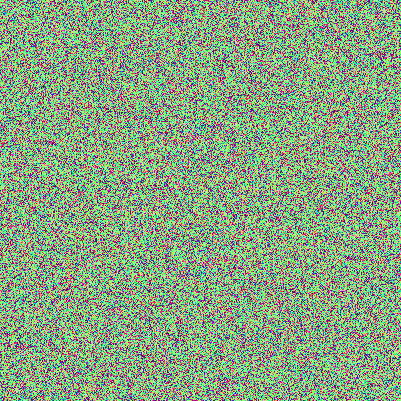
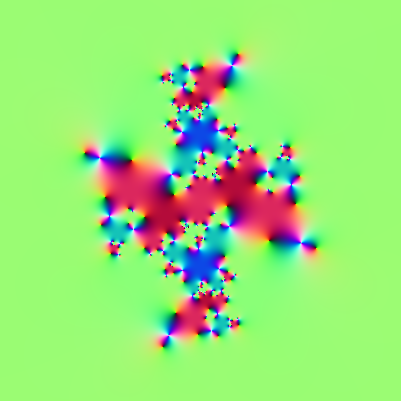
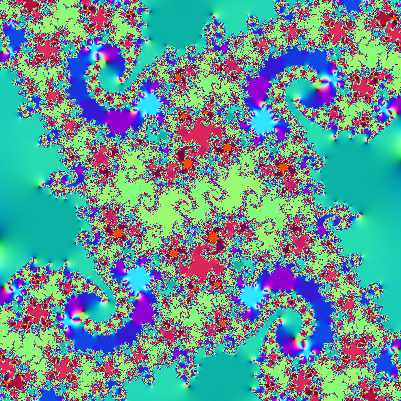
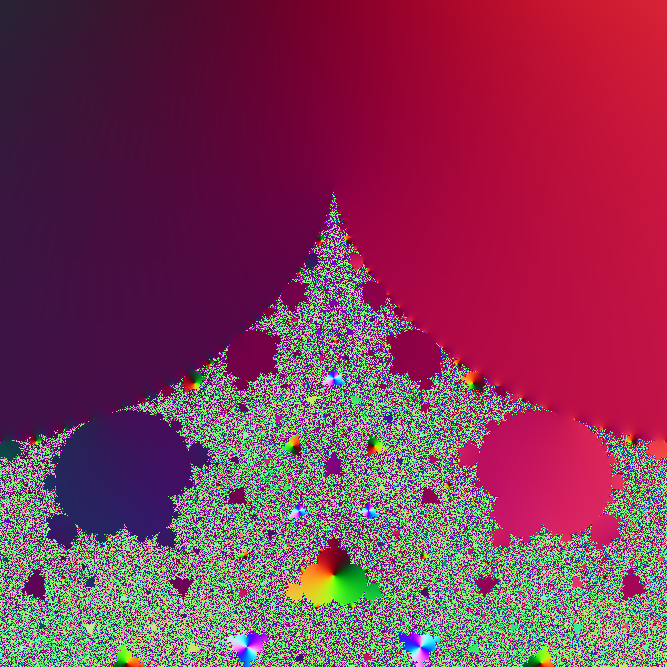
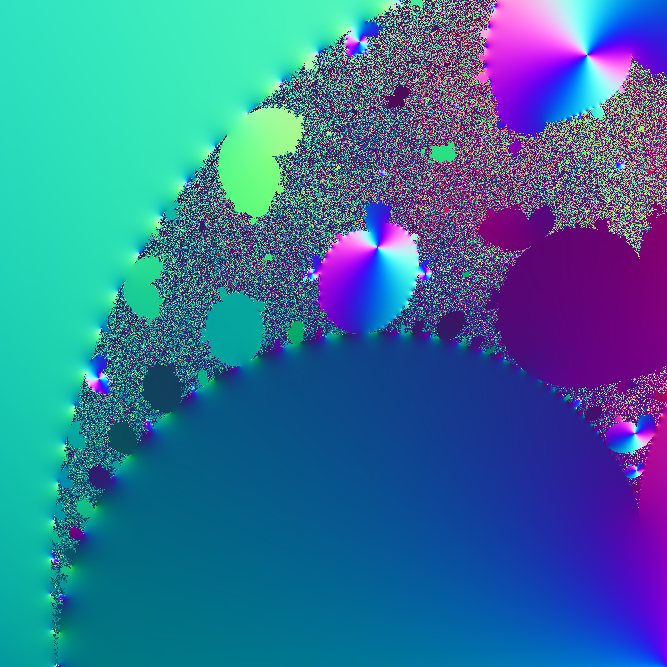
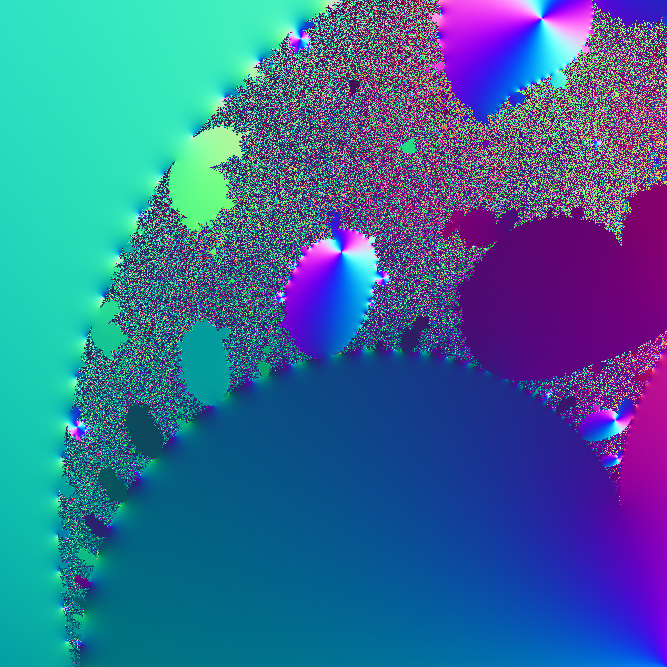
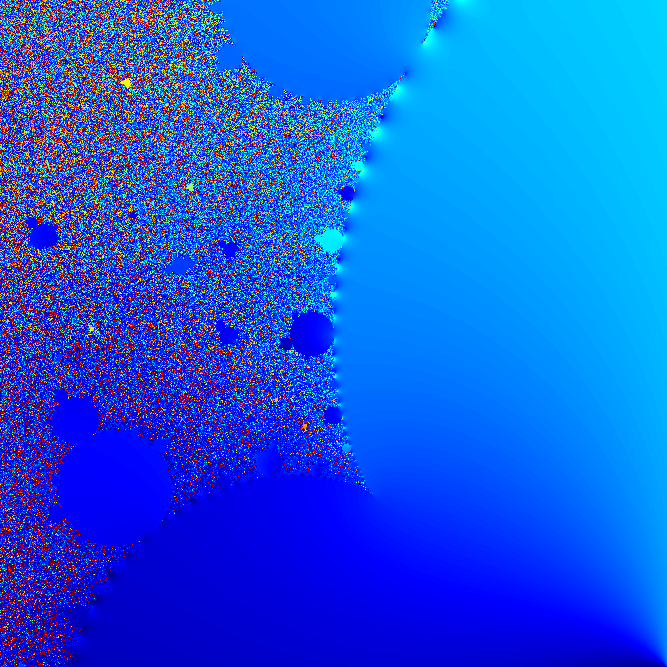
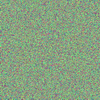
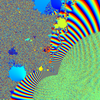
As c is varied we get "explosions": for some values the Julia set becomes the
entire plane - as c changes the image warps and expands until everything becomes
part of the chaotic border (some parts of the plane may persist for very long
against the flooding but eventually succumb; however, there are also sets that
are Sierpinski carpets with single-colored "holes" that are actually
stable). But unlike polynomial iterations the spread of the border appears to
be relatively slow for this map. It usually takes many iterations before everything
becomes chaos, and in the meantime there is a wonderful spectacle of twirling
tentacles. These fractals appear much more like the fractals based on sets of
M�bius maps described in Indra's
Pearls than the Mandelbrot-Julia fractals. They often have luxurious
loxodromic spirals. On the other hand, in some regions they clearly show their
quadratic pedigree, and in others look just like television noise.
Abalone-Mandelbrot
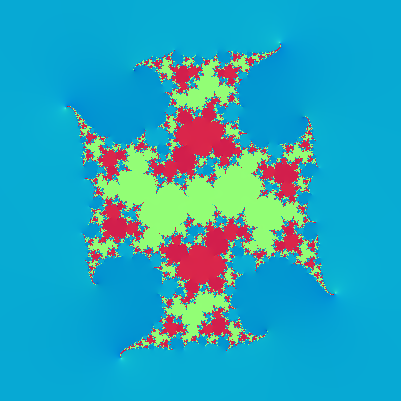
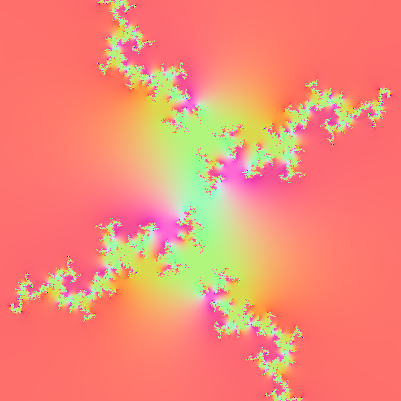
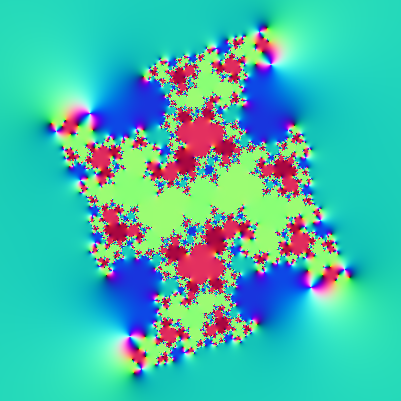
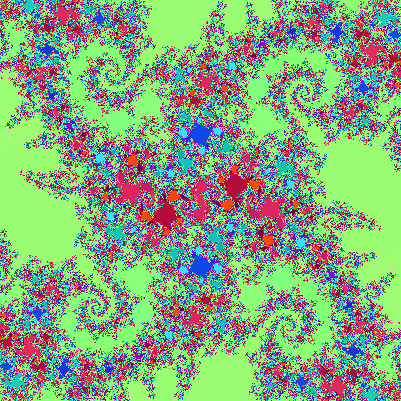
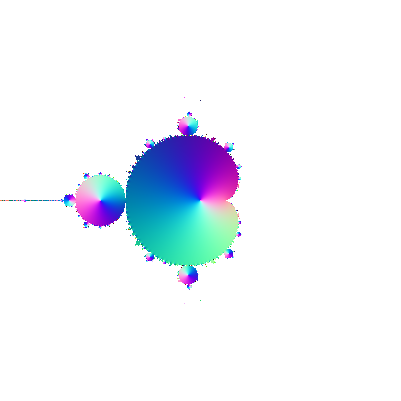
What parameters c produce plane-filling chaos? One way of exploring it is to
look at a representative point like 0 and iterate it, plotting where it ends
up as a color. If the parameter produces chaos then that color is likely to
be entirely different from neighbouring c-values and we get a chaotic coloring
of the c-plane. If the Julia set is a simpler fractal it is likely that the
color will remain roughly the same. Plotting this we get a very nice fractal.
 At
the centre c=0 we have the stable point where nothing happens (everything maps
to zero). Around it are c values where we get convergence to a single fixed
point (the two circular regions). The Julia sets from here consist of fractal
dust. Outside the crescent fractal there is an infinite region oscillating in
a two-cycle with Julia sets that are essentially fractally deformed circles.
Inside the crescents we have the chaotic values, as well as regions corresponding
to various periodic cycles. Right above the centre there is a two-eared region
corresponding to three-cycles. Every third iteration the map from the centre
of it maps c to infinity, then to zero and then to c (as you can guess, it is
c=i). Above the 3-cycle region is a circular region with 4-cycles. To the right
of the 3-cycle region there is a 5-cycle region and to the right of the 4-cycle
a 6-cycle region, followed by a 7-cycle and 8-cycle. The odd cycles are on the
inside and the even on the outside. And they are decorated by multiples of their
basic cycle, and so on. The white spots in some regions reveal that for the
central c-value, zero is a part of the attractive cycle (and the cycle is hence
superstable - all z-points are attracted to it extra fast). As the map is iterated
they blink on and off. Notice the cardioids and circles-on-circles - this is
very reminiscent of the Mandelbrot set. Which shouldn't be strange, since this
is a kind of Mandelbrot set for f(z). Plotted in the same way the ordinary mandelbrot
set looks fairly similar (with the exception that all of the surroundings end
up converging to infinity).
At
the centre c=0 we have the stable point where nothing happens (everything maps
to zero). Around it are c values where we get convergence to a single fixed
point (the two circular regions). The Julia sets from here consist of fractal
dust. Outside the crescent fractal there is an infinite region oscillating in
a two-cycle with Julia sets that are essentially fractally deformed circles.
Inside the crescents we have the chaotic values, as well as regions corresponding
to various periodic cycles. Right above the centre there is a two-eared region
corresponding to three-cycles. Every third iteration the map from the centre
of it maps c to infinity, then to zero and then to c (as you can guess, it is
c=i). Above the 3-cycle region is a circular region with 4-cycles. To the right
of the 3-cycle region there is a 5-cycle region and to the right of the 4-cycle
a 6-cycle region, followed by a 7-cycle and 8-cycle. The odd cycles are on the
inside and the even on the outside. And they are decorated by multiples of their
basic cycle, and so on. The white spots in some regions reveal that for the
central c-value, zero is a part of the attractive cycle (and the cycle is hence
superstable - all z-points are attracted to it extra fast). As the map is iterated
they blink on and off. Notice the cardioids and circles-on-circles - this is
very reminiscent of the Mandelbrot set. Which shouldn't be strange, since this
is a kind of Mandelbrot set for f(z). Plotted in the same way the ordinary mandelbrot
set looks fairly similar (with the exception that all of the surroundings end
up converging to infinity).
 A
proper Mandelbrot set would look at the critical points of f(z) rather than
some arbitrary starting point, since the Fatou theorem says that if there is
any attracting cycle it will attract at least one critical point. This is good
because we want to find out if there are attracting cycles. Luckily for me zero
happened to be a critical point df(z)/dz=0 of the map, and the other one is
infinity which is also mapped to zero. Starting from other points produces slightly
different images but with the same overall structure as long as the starting
points are close to zero. In fact, one can view the entire set of starting points
and parameters as a 4D space where the Julia sets are organized perpendicular
(c=constant planes) to the Mandelbrot set (the z0=0 plane).
A
proper Mandelbrot set would look at the critical points of f(z) rather than
some arbitrary starting point, since the Fatou theorem says that if there is
any attracting cycle it will attract at least one critical point. This is good
because we want to find out if there are attracting cycles. Luckily for me zero
happened to be a critical point df(z)/dz=0 of the map, and the other one is
infinity which is also mapped to zero. Starting from other points produces slightly
different images but with the same overall structure as long as the starting
points are close to zero. In fact, one can view the entire set of starting points
and parameters as a 4D space where the Julia sets are organized perpendicular
(c=constant planes) to the Mandelbrot set (the z0=0 plane).
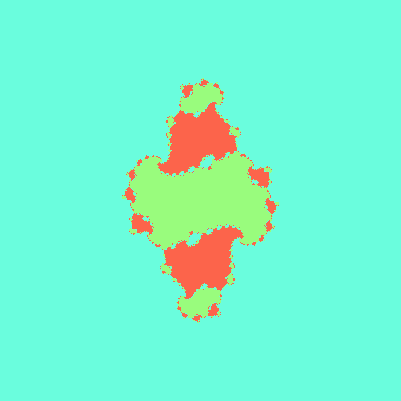
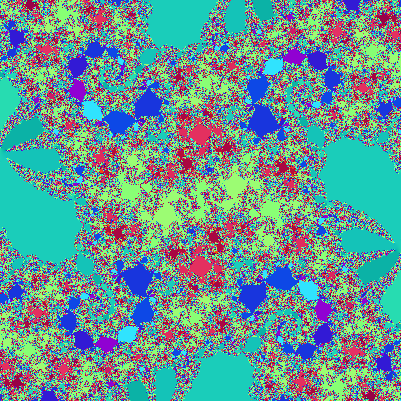
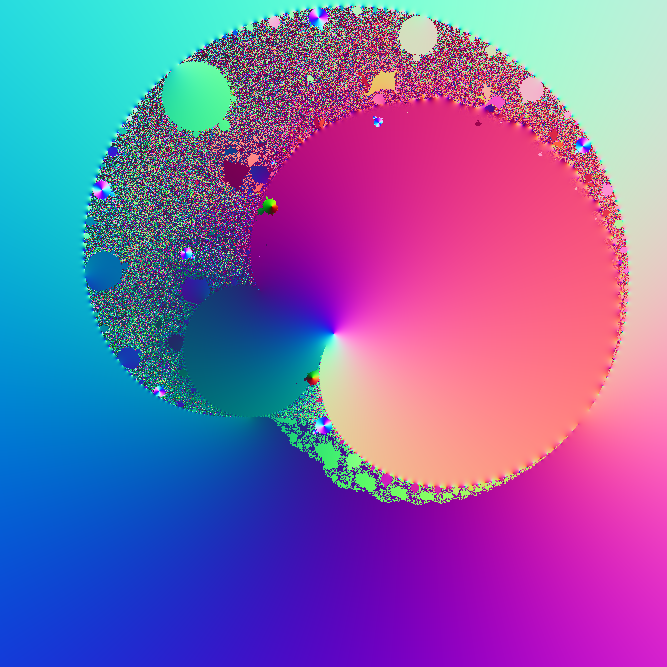
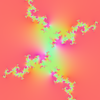
Asymmetric Map
We can modify f in many ways. One nice try is g(z)=c/(1+z2+(1+i)z)

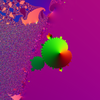
This asymmetry produces a twisted image, a bit like an abalone shell. Hence
my name for this family of fractals.
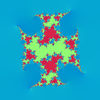
But what is that little object hanging inside the central fixed point region?
A zoom reveals the charming truth: a mini-Mandelbrot! The poor thing looks slightly
bent, but otherwise clearly a typical Mandelbrot set. It corresponds to a 3-cycle,
with the biggest bulb a 6-cycle, the second largest 9-cycles and so on. The
chaotic regions repeat the same tendency towards 3-cycles in the tendrils above
the set and the spirals dissipating down into the fuchsia depths of the fixed
point region - with tiny tendrils from the Mandelbrot clearly extending inwards.
Small mandelbrots appear everywhere. This is due to universality: any function
that looks like z2+c in the vicinity of some point will tend to produce
mandelbrots, and since that is hard to avoid looking quadric they are ubiquitous.
It is like the universality of the Feigenbaum period doubling cascade for 1D
maps. Still, it is amazing. There are also regions looking like the Mandelbrot
set for z4+c in the chaos, even in the original formula.
So where did the Mandelbrot come from? Looking at the family f(z,t)=c/(1+z2+t(1+i)z)
from t=0 to t=1 above shows that the 3-cycle region gets squeezed and pinched
until parts of it become a Mandelbrot! The same thing happens to all the other
odd regions to the right, while the left ones drop off pieces into the chaos.
The even regions instead turn more circular and appear to be content to sit
where they are. One explanation might be that the high symmetry of the original
case vanishes, making the structurally unstable regions shift into more stable
mandelbrots and buds.
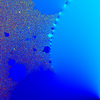
Using z=0 as starting point is not quite correct, since it is not a critical
point of g(z). But infinity remains critical and is immediately mapped to 0,
so it doesn't matter (whew!). The other critical point is -(1+i)/2. Since the
two critical points now in general are distinct they can produce different behaviors.
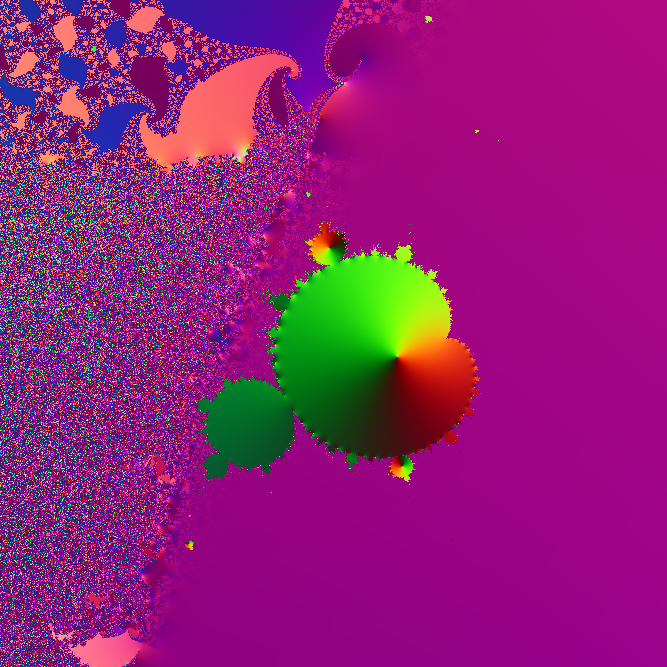
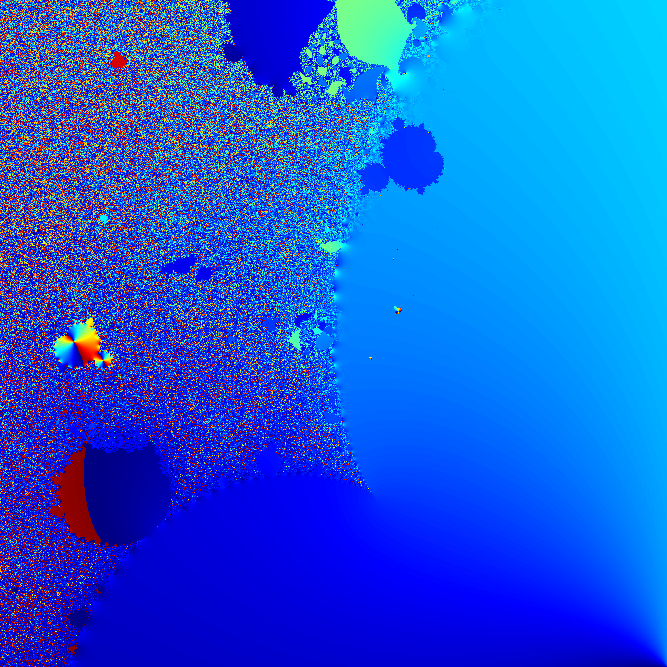
Looking at the Mandelbrot set when starting with z=-(1+i)/2 (above left; I used
another colormap here to show the argument of points) shows the same general
features. The surprise here is that there is no corresponding little Mandelbrot!
Instead there are others in other locations. The explanation is that the dynamics
is now bistable. For the same c there can exist two different attractors, making
one critical point go to one of them and the other to the other.

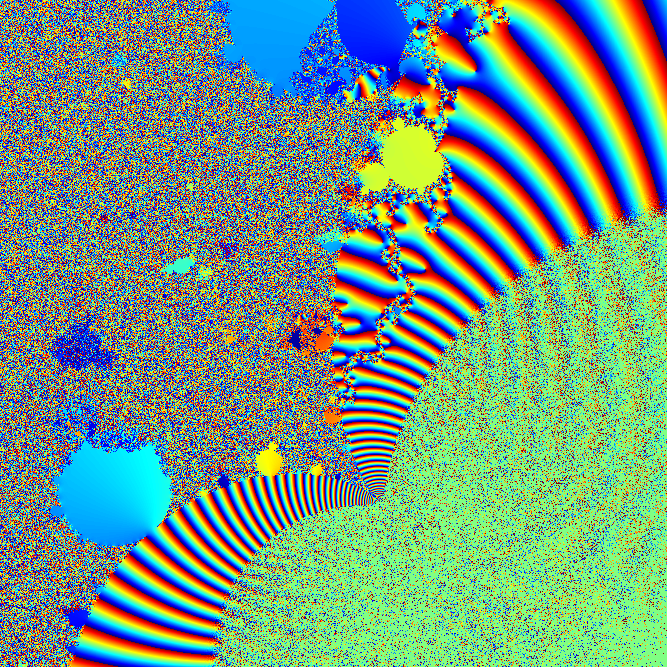
Plotting the difference between the arguments of the iterates (above left)
shows a lot of complex hidden structure. Among other things there is a large
area around the edge of the fixed point region where they both converge to slightly
different fixed points, producing the banded pattern. The tendrils extending
around the small Mandelbrot set are visible as changes of phase - here is a
case of true bistability. The messy green region is actually a region where
both critical points converge to the same point, but precision errors and a
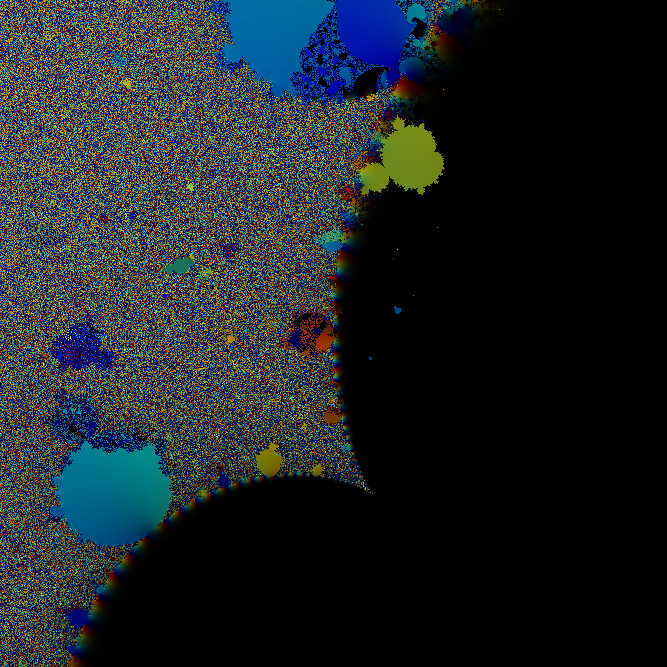
finite number of iterations create noise. In fact, they seem to be converging
along different routes and with very long transients (in the above right plot
I set the brightness to correspond to 1/(1+1/|z1-z2| to show this - everything
ends up close together in the dark regions). Even more fun, while the Mandelbrot
we have looked at most corresponds to a 3-cycle that is bistable with a fixed
point the Mandelbrot inside the chaotic region is a periodic point bistable
with chaos itself. choosing other starting values for the iteration produces
"dragon curves" on the outer edge of the set. Apparently some points get out
of phase with the 2-cycle.
Some things I wonder about
What about the Mandelbrot-like colored patches inside the crescents? They do
not seem to have the same structure as Mandelbrots (which are after all something
like the Feigenbaum cascade generalized into 2D), but rather Jordan curves not
unlike well-behaved filled in Julia sets. Their shapes appear to follow some
kind of syntax and they often form networks that are nicely self-similar locally.
Their Julia sets are chaotic messes with isolated balls or blobs of cyclic points.
Given the behavior for f(z,t) they seem to be cross sections of Mandelbrot-sets
seen "slanted" in the 6D space of (c,z0,t), but the bizarre
behavior of the regions as t is changed makes one wonder about the true structure
of the sets of p-cycles. They seem to be branching and sprouting mini-regions
of higher multiple cycles.
What is the link between these images and Kleinian group fractals? The behavior
of the regions of periodic points seem to have similarities with what happens
in the Klein fractals - parts joining and separating depending on whether the
group is free etc.
Programs
I did these pictures in Matlab using the following programs (among others).
dimandala.m Draw the basic Abalone-Mandelbrot set.
dimandala2.m Draw the basic Abalone-Julia set.
dimandala4.m Draw the Abalone-Mandelbrot sets for
the modified system for both critical points.
dimandalam2.m Draw interpolated sequence of Abalone-Mandelbrots
for f(z,t).
dimanjul.m Interactive zoom and Julia construction.
Links
Rational mappings of the complex plane have been studied quite a bit.
Remarks on quadratic rational
maps by John W. Milnor (math.DS/9209221). Lots of information for those
of a mathematical bent.
Mandelbrot
Set of Quadratic Rational Functions in the Fractal Gallery of William Gilbert.
Some other nice rational mandelbrots. See also moduli
spaces.
The
Mandelbrot Set is Universal by Curtis T. McMullen. Shows why we should expect
small Mandelbrots.
Frontiers
in complex dynamics by Curtis T. McMullen.
 The
coloring used below is as follows: the red and green component are colored depending
on the sine and cosine of the argument of the point, while the blue component
is 1/(1+abs(z)). Zeros will have some white in their vicinity, poles some black.
The
coloring used below is as follows: the red and green component are colored depending
on the sine and cosine of the argument of the point, while the blue component
is 1/(1+abs(z)). Zeros will have some white in their vicinity, poles some black.